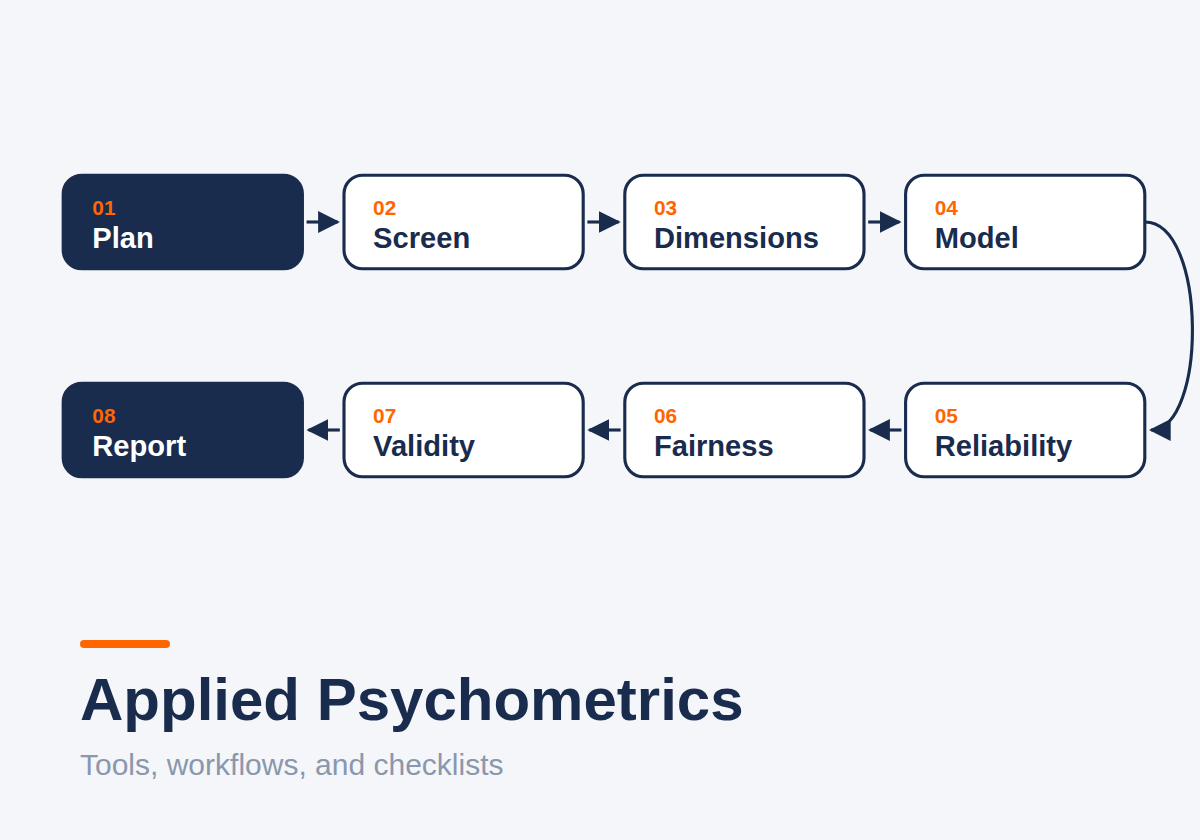
Textbooks teach psychometrics one model at a time. Real projects do not arrive that way. They arrive as a spreadsheet, a deadline, and a question like "is this scale any good?" This post is the workflow I actually use, the tools I reach for, and the checklists that keep me honest.
Start with the decision, not the model
Before any analysis, write down three things:
- The intended use. Screening? Research comparisons between groups? High-stakes placement? The same scale can be fine for one and inadequate for another.
- The construct. A one-paragraph definition, including what it is not.
- The claims. "Scores reflect a single dimension." "Scores mean the same across languages." Each claim becomes something to check.
This sounds like paperwork. It is actually the analysis plan. Validity is about evidence for a specific interpretation and use, so if you do not know the use, you cannot know what evidence you need.
The workflow
1. Screen the data
- Response distributions for every item: floor and ceiling effects, empty categories, odd spikes.
- Missingness: how much, where, and whether it looks related to anything.
- Reverse-keyed items recoded (and checked, because this goes wrong constantly).
- Careless responding: long strings, impossible response times, failed attention checks.
2. Check dimensionality
Before fitting the model you believe, find out what structure the data support. Parallel analysis and exploratory factor analysis on a training split, or exploratory graph analysis, give you an honest picture. Then confirm on held-out data with a CFA. Using the same data to discover and confirm a structure is how scales end up with factors that never replicate.
3. Fit the measurement model
- CFA when the question is structure and relations with other variables.
- IRT when the question is item-level behavior: difficulty, discrimination, information across the trait range. My 2PL vs GRM post covers the model choice.
- Check local fit and local dependence, not just global fit indices.
4. Estimate reliability properly
Coefficient alpha assumes every item measures the construct equally well. That rarely holds. Report omega from the fitted model instead, with a confidence interval. In IRT, look at the test information function: reliability is not one number, it changes across the trait range.
5. Check fairness across groups
If scores will be compared across groups, test measurement invariance (see the invariance checklist) and item-level DIF (see detecting item bias). If you skip this step, you are assuming the answer.
6. Gather validity evidence beyond the model
Internal structure is one source of evidence. The others matter just as much: content (do experts agree the items cover the construct?), response processes (do people interpret the items as intended?), relations with other variables (does the scale correlate with what it should, and not with what it should not?), and consequences of use.
7. Report so someone could redo it
Share code, software versions, the exact model syntax, and every decision point. A reproducible pipeline (R + Quarto + Git) turns "trust me" into "check for yourself".
The toolbox
Almost everything above can be done in R:
- psych: descriptives, parallel analysis, EFA, omega.
- lavaan and semTools: CFA, SEM, invariance testing, reliability from fitted models.
- mirt: unidimensional and multidimensional IRT, multiple-group models, item fit.
- EGAnet: exploratory graph analysis for dimensionality and item stability.
- difR and lordif: DIF detection.
- Quarto: one document from data to report.
Quick R sketch
library(psych); library(lavaan); library(semTools); library(mirt)

set.seed(2025)
idx   <- sample(nrow(items), nrow(items) / 2)
train <- items[idx, ]; test <- items[-idx, ]

# dimensionality on the training half
fa.parallel(train, fa = "fa", cor = "poly")

# confirm on the held-out half
fit <- cfa('f =~ i1 + i2 + i3 + i4 + i5 + i6', data = test,
           ordered = TRUE, estimator = "WLSMV")
summary(fit, fit.measures = TRUE, standardized = TRUE)
compRelSEM(fit)   # omega-type reliability from the fitted model

# item-level view
irt <- mirt(test, 1, itemtype = "graded")
itemfit(irt)
plot(irt, type = "info")
The one-page checklist
- Intended use, construct definition, and claims are written down.
- Items screened; recoding verified; missingness described.
- Dimensionality explored and confirmed on separate data.
- Model chosen for the response format; local fit checked.
- Reliability reported as omega or information, with uncertainty.
- Invariance and DIF tested for every group comparison you plan to make.
- Validity evidence from more than one source.
- Code and decisions shared.
Closing
Good psychometrics is less about exotic models and more about doing the ordinary steps in the right order, and writing down why. The checklist will not make a weak scale strong, but it will tell you, early and honestly, which one you have.
- Fatih